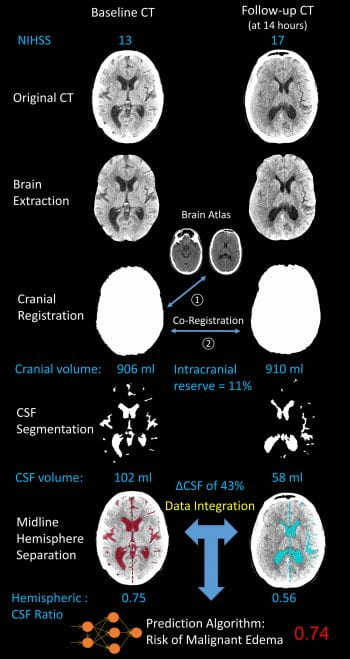
We measure the intracranial CSF volume over serial CTs in patients with ischemic stroke to understand how edema develops. The displacement of CSF serves as an easily accessible imaging surrogate for the volumetric brain swelling after stroke. Those with more severe cerebral edema have more rapid and progressive displacement of CSF from the brain. This approach to map the development of edema over time and understand factors exacerbating and attenuating edema formation.
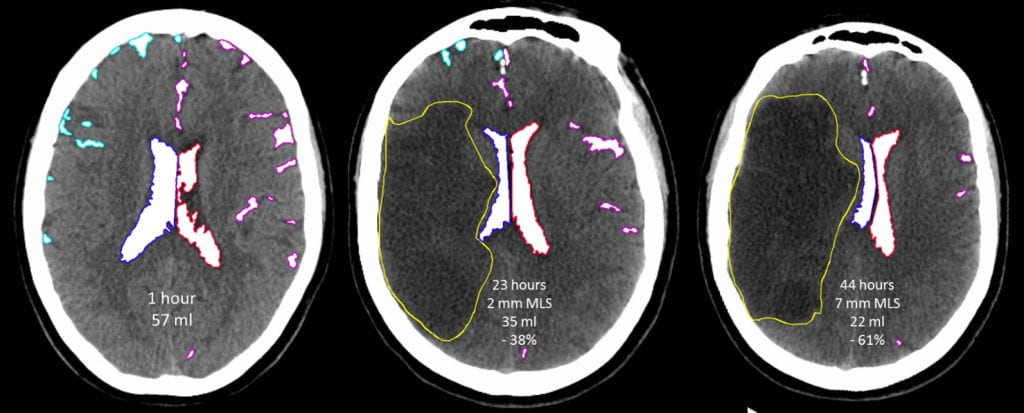
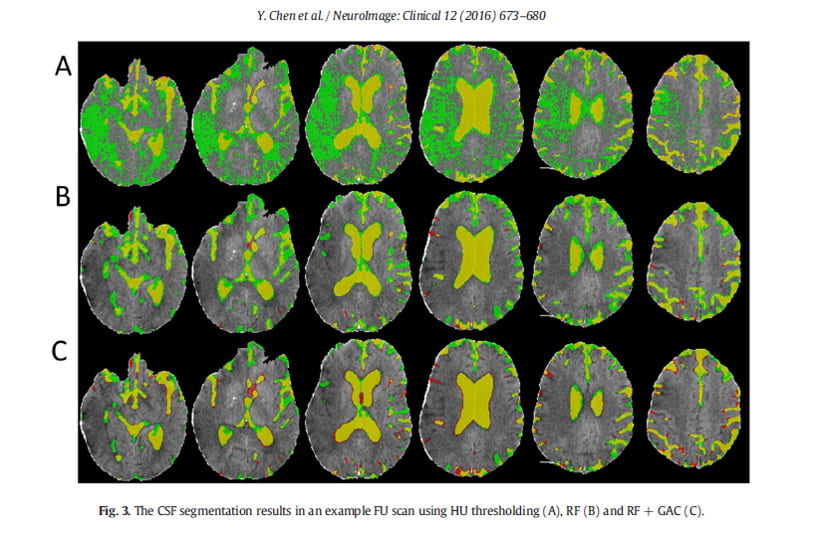
To apply CSF volumetric methods to understand edema in large cohorts of patients, we have developed automated imaging algorithms (based on machine learning, using neural networks) to segment regions of CSF (sulci and ventricles) from routine quality head CTs of stroke patients. This has allowed us to extract CSF volume and map its trajectory in thousands of patients. This work demonstrated that the majority of CSF is displaced within 24-hours of stroke onset, even though deterioration and midline shift develop later.
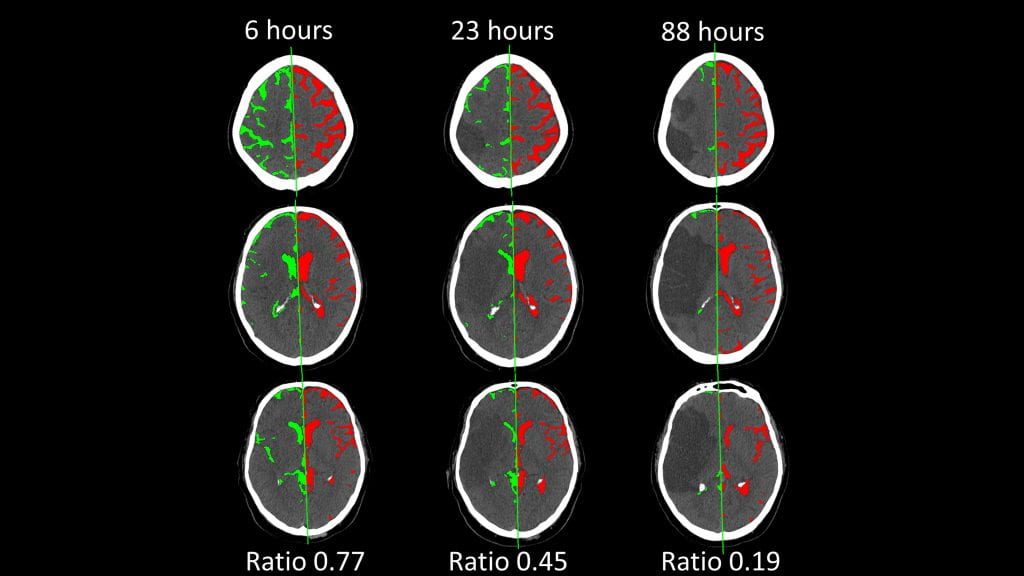
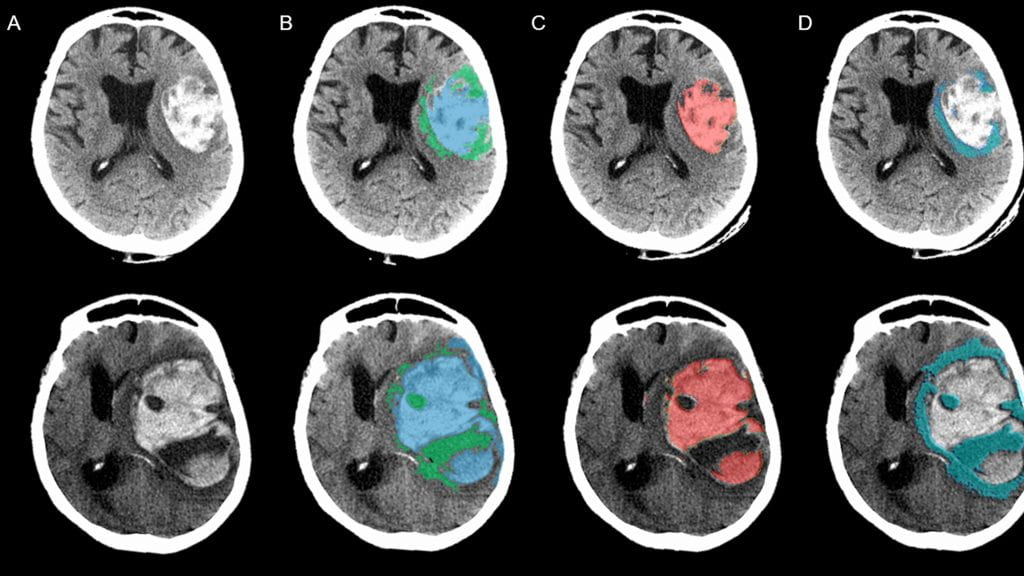
We have studied how CSF is preferentially displaced from the hemisphere ipsilateral to the stroke. This builds upon our CSF segmentation algorithm, requiring accurate extraction of the brain midline on all slices of routinely performed head CTs. We then measure CSF volume in each hemisphere (green vs. red) and calculate the ratio of the stroke vs. contralateral hemisphere. We have shown that this hemispheric CSF ratio progressively decreases over time, as edema develops. It is strongly associated with development of midline shift and edema-related complications.
To facilitate processing of large volumes of imaging data from thousands of patients, we are developing automated processing pipelines. These integrate the segmentation of CSF and other brain compartments with pre-processing and registration steps, to obtain rapid, accurate, automated results from serial CT scans of stroke patients.
We are also developing an imaging platform to archive, organize, and analyze imaging from many thousands of stroke patients of all kinds from around the world. This platform is based on the XNAT architecture, developed at Washington University in St. Louis by our collaborator, Dr. Dan Marcus in radiology. This platform is called: SNIPR (Stroke NeuroImaging Phenotype Repository). It can integrate processing pipelines to run in parallel on high-performance computing clusters. This will facilitate a big-data approach to extracting imaging phenotypes of stroke (as described for project, below).
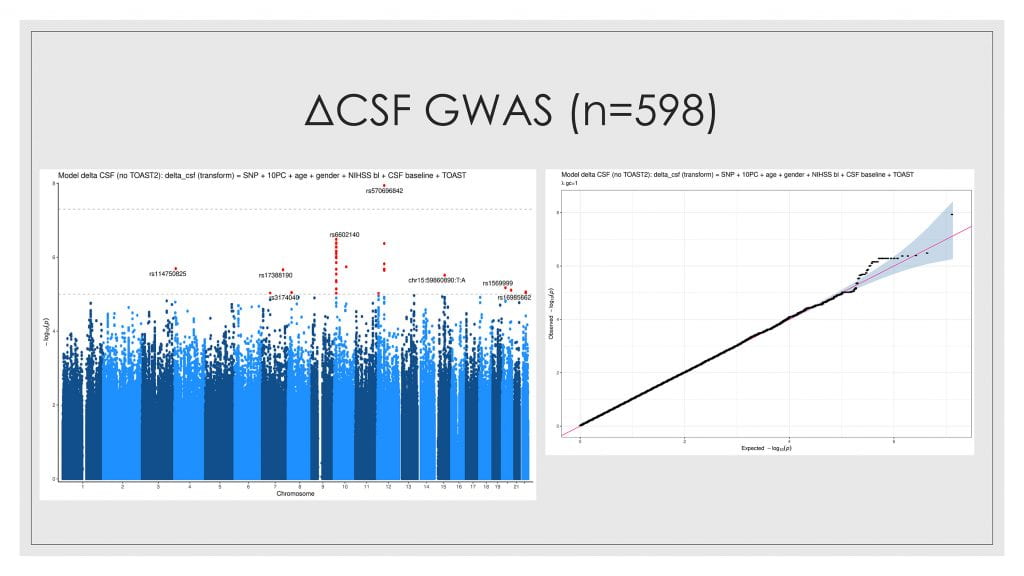
We are core collaborators in the ground-breaking GENISIS study, led by Dr. Jin-Moo Lee at Washington University in St. Louis. This study has assembled a well-phenotyped cohort of over 6,000 patients with acute stroke from sites around the world, who have consented to provide genetic data. We are analyzing the relationship of genomics to edema phenotypes, supported by a K23 career development grant from the National Institutes of Neurological Disorders and Stroke. We are indebted to collaborators around the world for this data, which includes several thousand imaging studies, now stored in SNIPR (the imaging repository, described above).
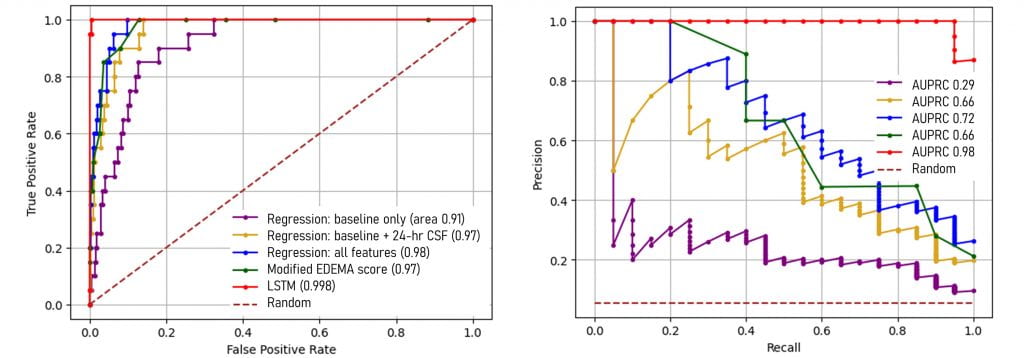
We are interested in big data and artificial intelligence-based approaches to improve the prediction of severe complications after stroke and other brain injuries. For example, we have used a recurrent neural network (LSTM model) to integrate volumetric data from serial CTs and clinical assessments to improve the prediction of which stroke patients will develop malignant edema and require surgery. We have shown that the combination of data (CSF volume, ratio, and NIHSS) at 24-hours after stroke allow high precision for prediction of these critical events.
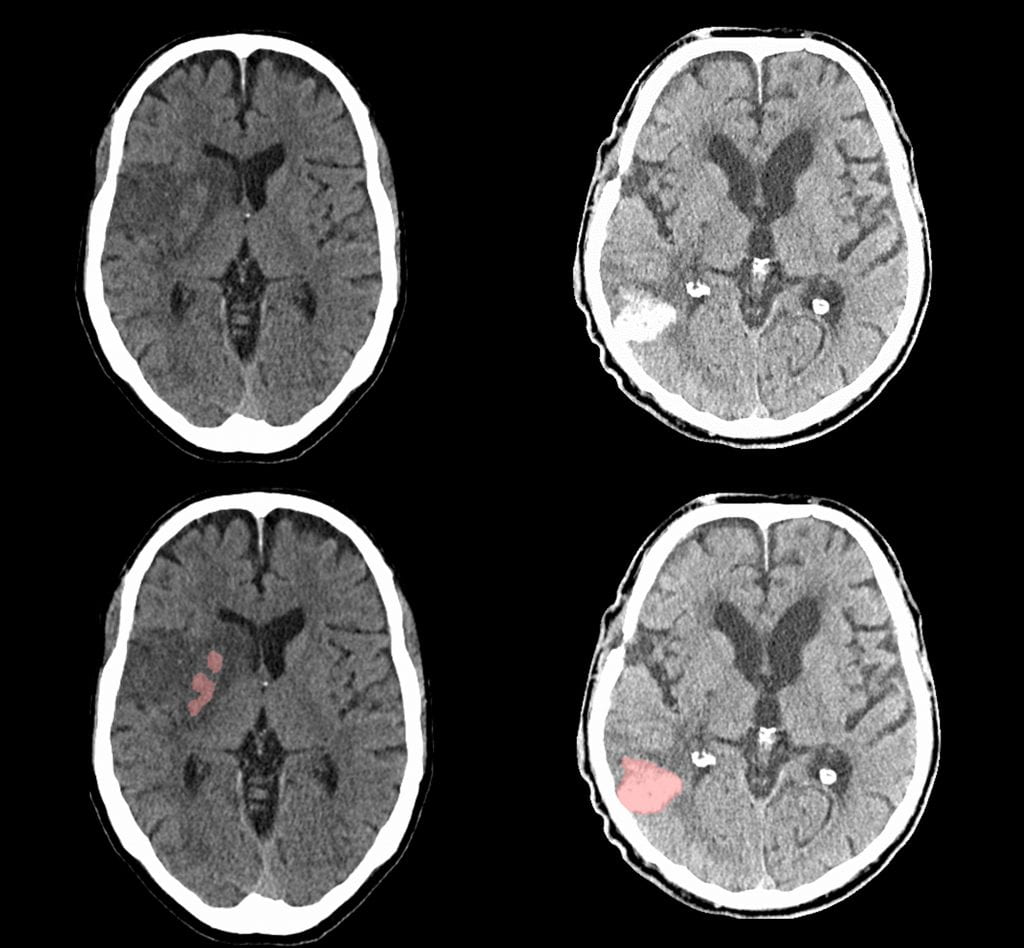
Intracerebral hemorrhage is a particularly severe form of stroke. Larger volumes of blood within the brain contributes to injury and is strongly associated with poor functional recovery. Development of edema (low-density regions) around the hematoma (termed: perihematomal edema, PHE) has been associated with neurologic deterioration and worse outcomes. We have developed automated algorithms to extract these two biomarkers of injury from large cohorts of ICH patients. This project was in collaboration with the lab of Dr. Guido Falcone at Yale University School of Medicine. These algorithms can be applied to measure ICH and PHE volumes in large cohorts and understand factors contributing to these.
Subarachnoid hemorrhage (SAH) occurs after rupture of an intracranial aneurysm, resulting in blood within the cisterns, sulci, and ventricular compartments of the brain. The survival and recovery of patients with SAH is threatened by both early brain injury (predominantly developed of global cerebral edema, resulting in deterioration and elevated ICP) and delayed cerebral ischemia, associated with arterial vasospasm. We are studying imaging biomarkers: compartmental blood volume and effacement of CSF in the sulci, as means of understanding these critical complications. We are also collecting genetic data on SAH patients, in collaboration with the lab of Dr. Gregory Zipfel, the chair of neurosurgery.
Subarachnoid hemorrhage (SAH) occurs after rupture of an intracranial aneurysm, resulting in blood within the cisterns, sulci, and ventricular compartments of the brain. The survival and recovery of patients with SAH is threatened by both early brain injury (predominantly developed of global cerebral edema, resulting in deterioration and elevated ICP) and delayed cerebral ischemia, associated with arterial vasospasm. We are studying imaging biomarkers: compartmental blood volume and effacement of CSF in the sulci, as means of understanding these critical complications. We are also collecting genetic data on SAH patients, in collaboration with the lab of Dr. Gregory Zipfel, the chair of neurosurgery.

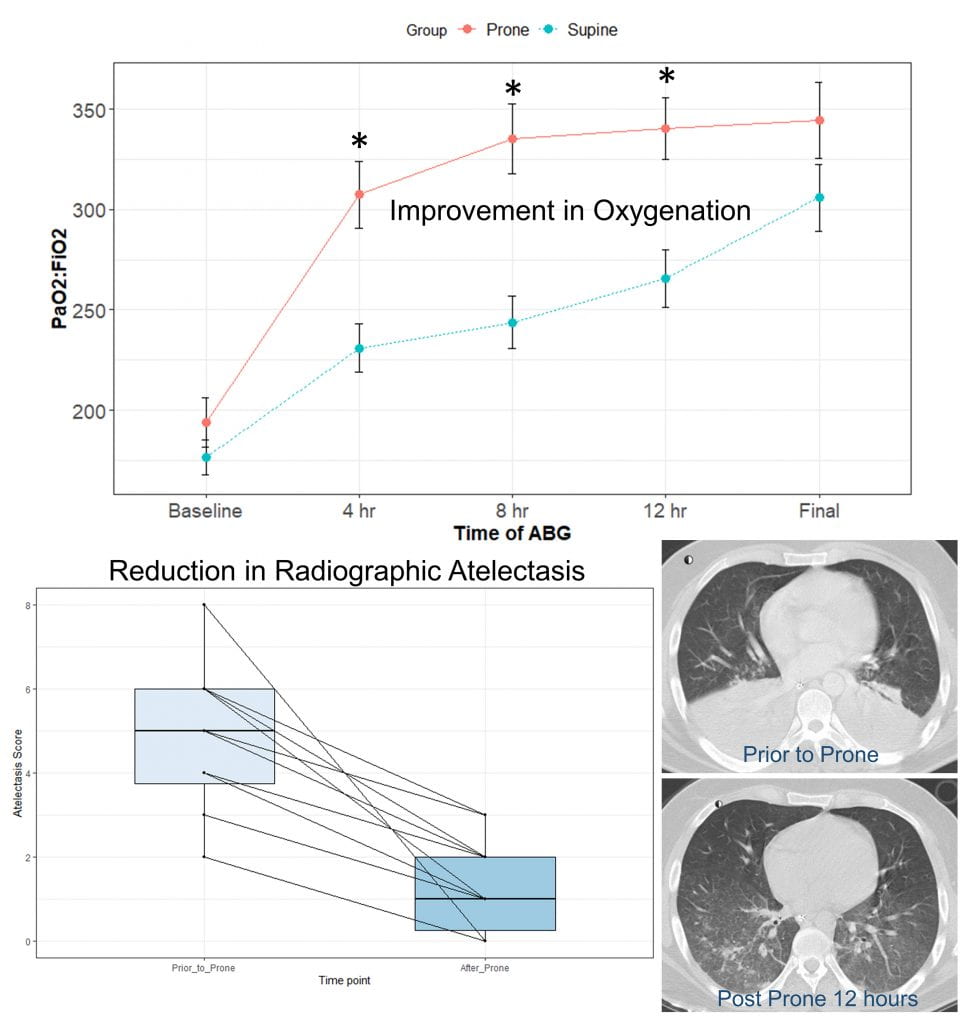
Brain death is the terminal result of catastrophic brain injury, whether after trauma, stroke, or subarachnoid hemorrhage. Complete loss of brain function results in physiologic derangements including hypotension, hypoxemia, and hormonal deficiencies. These may impact the ability of patients (through their families) to donate their organs after death to those waiting on the transplant list. In collaboration with the organ procurement organization, Mid-America Transplant, and the national Organ Donation Research Council, Dhar has been researching means of supporting the brain-dead organ donor to improve organ function and ensure that the gift provided is not wasted. This has included clinical trials testing interventions to improve heart and lung function. A recently concluded trial demonstrated that placing donors with hypoxemia and atelectasis in the prone position improved oxygenation and resulted in more lungs transplanted. Dhar is PI of a multi-site randomized controlled trial that is testing whether thyroid hormone replacement improves hemodynamic stability and results in more hearts transplanted.